With our 4 simple steps you can Translate Data into Commercially Valuable Insights easily
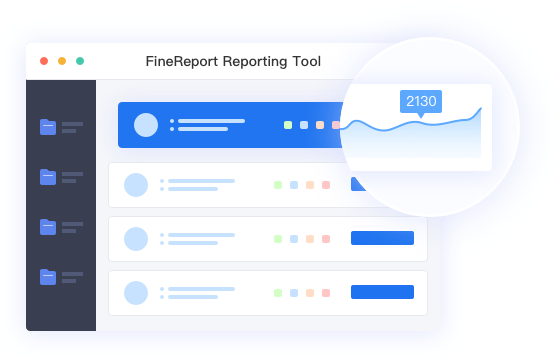
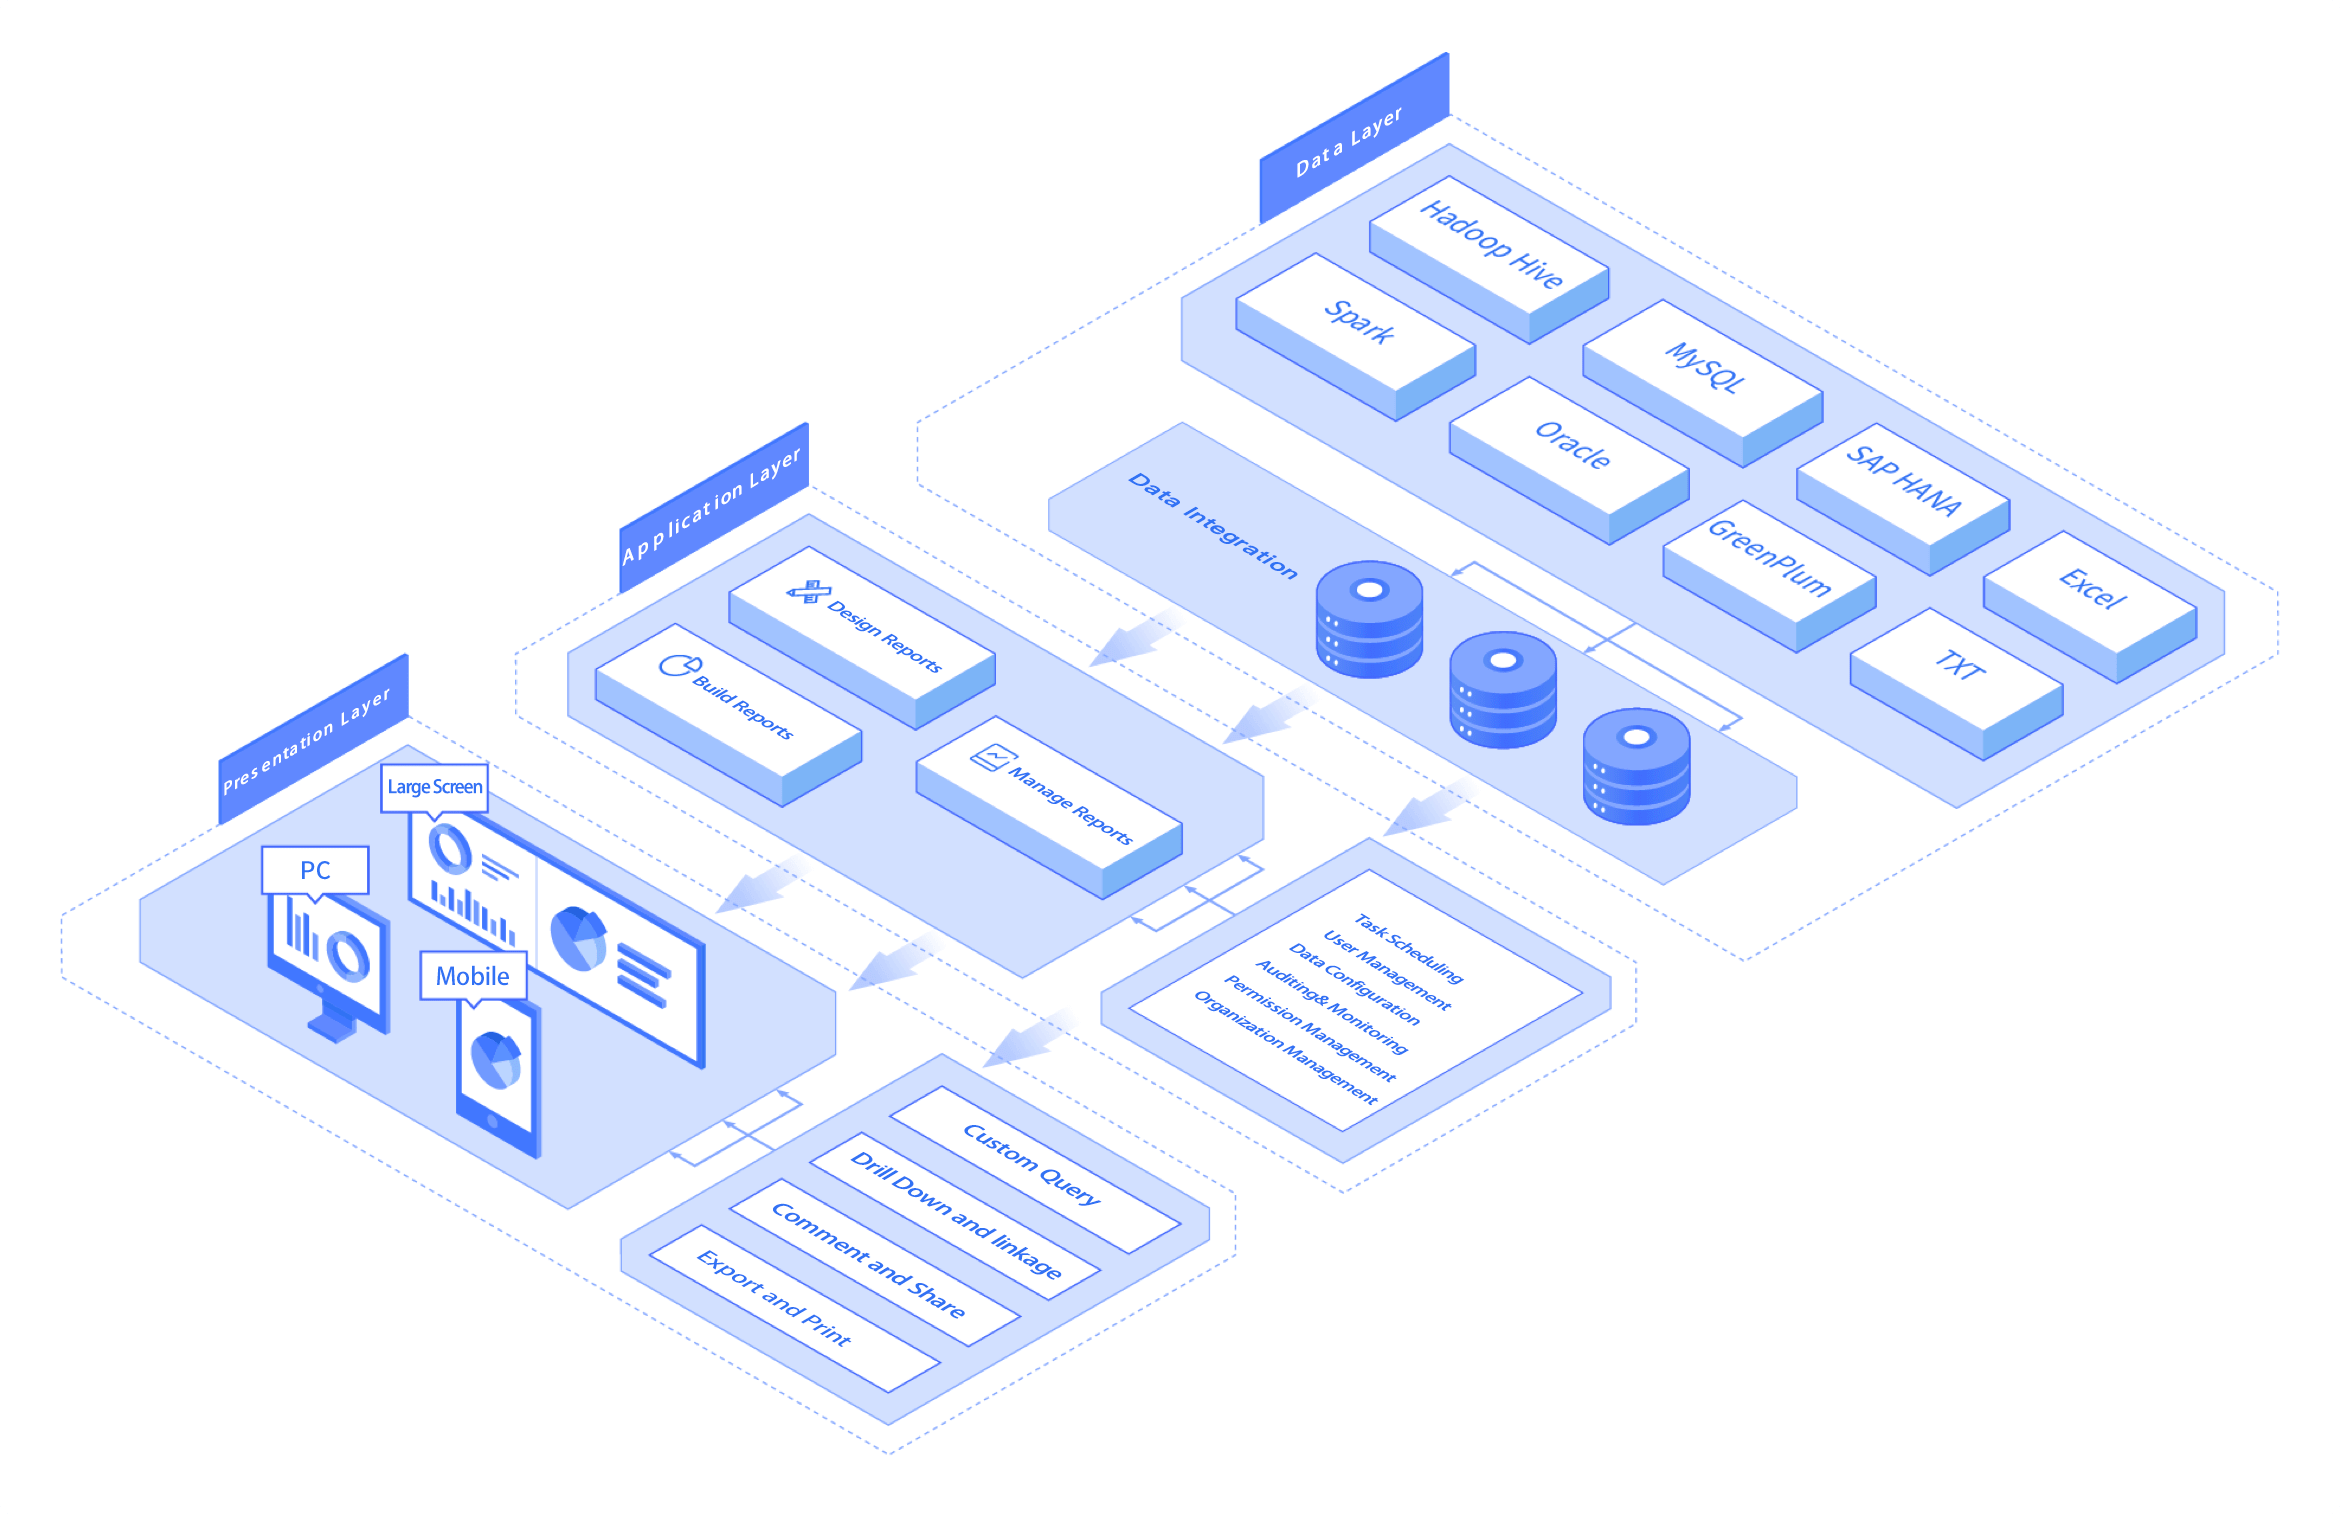
1. Connect to the Data sources
Integrate data from various sources into meaningful information


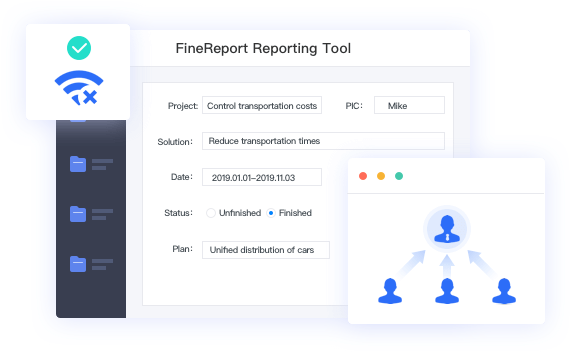
2. Process Basic Data
Bind data to cell for quick filter computation and analysis.
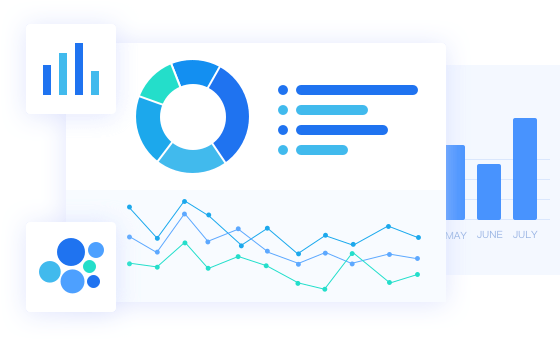
3. Design and Generate Reports
Realize cool data with more than 50 chart styles and 100 templates


4. Publish, Browse and Analyze
Publish reports to the report server, Browse and Analyze report on PC, Mobile devices and Large screen

